I built a data pipeline to track my coffee spending
I built a data pipeline to track my coffee spending
Yes, really.
I built a terabyte-scale data pipeline to track my coffee spending, and it costs less than $2 a month.
The premise
Let's be honest: I built a full-blown data engineering platform to categorize my grocery receipts. Could I have used a spreadsheet? Absolutely. Did I? No. I wanted to learn Google Dataflow and Apache Beam, and personal expense tracking seemed like the perfect excuse.
Dataflow is designed for terabyte-scale data pipelines. My monthly transaction data? A few kilobytes. But the learning was worth it. I spent a weekend debugging windowing functions, but now I actually understand streaming pipelines. And the cost? Less than my weekly coffee budget.
The goal
I wanted to automate my monthly expense report. Take bank transaction CSVs, categorize them automatically, and visualize spending trends. But instead of a simple Python script, I built an ETL pipeline using Google Dataflow, Apache Beam, and machine learning. Because why walk when you can run a marathon?
The workflow
1. Starting with a Google Sheet
I began with a Google Sheet, quick, easy, and perfect for testing. This sheet stored transaction categories, codes, and labeled data for training my ML model.
The sheet acted as both training data and taxonomy. I could add new codes, adjust categories, and track everything in one place. But to scale up, I moved this data to Google Cloud Storage and built a pipeline.
2. The ETL Pipeline
After storing bank transaction CSVs in Google Cloud Storage, I created a Dataflow pipeline using Apache Beam. The flow looked like this:
Step-by-step:
- Extract: Pull CSV files from Cloud Storage.
- Transform: Use a trained ML model to predict categories based on transaction descriptions.
- Load: Push categorized data into BigQuery for analysis.
The pipeline runs weekly. I manually drop CSV files into a folder (yes, I could automate that too, but manual works for now).
3. Training the Machine Learning Model
The goal is simple: given a raw bank transaction description, predict which category it belongs to.
Instead of writing fragile regex rules (“if description contains GRAB → Transport”) that break the moment Grab changes their merchant code, I manually labeled a batch of past transactions and let the model learn the patterns itself.
Training data sample:
| Category | Combined Feature |
|---|---|
| Cafes | POS 87435219 REFUEL J9 |
| Cell Phone/Internet | POS 87435219 MS 2 MOBILE |
| Dining Out | POS 87435219 REFUEL CAFE |
| Dining Out | POS 87435219 TAKAGI RAMEN |
| Dining Out | POS 87435219 WHALE LALA CAFE |
| Dining Out | POS 87435219 BUILDERS@WISTERIA |
The bank provides a reference code with each transaction. Label 50 of them and the model learns which reference patterns map to which categories.
I reached for scikit-learn’s random forest classifier — because why use an ensemble method designed for terabytes of data on a few hundred monthly transactions? It’s overkill, but that’s the point. I trained it on DBS bank statements I’d exported since 2019.
Prediction output sample:
| Input | Predicted Category | Confidence | Top Alternatives |
|---|---|---|---|
| ITR 302-88492-7 : I-BANK | Family Transfer - Dad | 95.00% | Repayment 4%, Family Transfer-In 1% |
| ICT PayNow 9345182 → STRIPE PAYMENTS SG | Others | 44.33% | Hobbies 13%, Repayment 8% |
The first transaction is familiar — 95% confidence, dead on. The second is a new vendor the model hasn’t seen before, so it outputs low confidence and flags it as “Others” for manual review. I designed the model to output prediction probabilities rather than hard assignments, which serves as built-in novelty detection. This creates an active learning loop: review unknowns, label them, feed them back in, and the model improves over time.
I also tried gradient boosting and a simple neural network, but the random forest worked best with almost no tuning. After training, I saved the model and uploaded it to Google Cloud Storage. The Dataflow pipeline loads it at runtime to categorize each transaction. No complex model serving infrastructure needed. Overkill? Yes. But I learned a ton about integrating ML into a live streaming pipeline.
Hindsight: I serialized the model with joblib and loaded it into Dataflow from GCS at runtime. BigQuery ML could have handled the entire ML workflow inside the warehouse — train, predict, and serve without any serialization or external model loading. Same random forest, less moving parts. Next time.
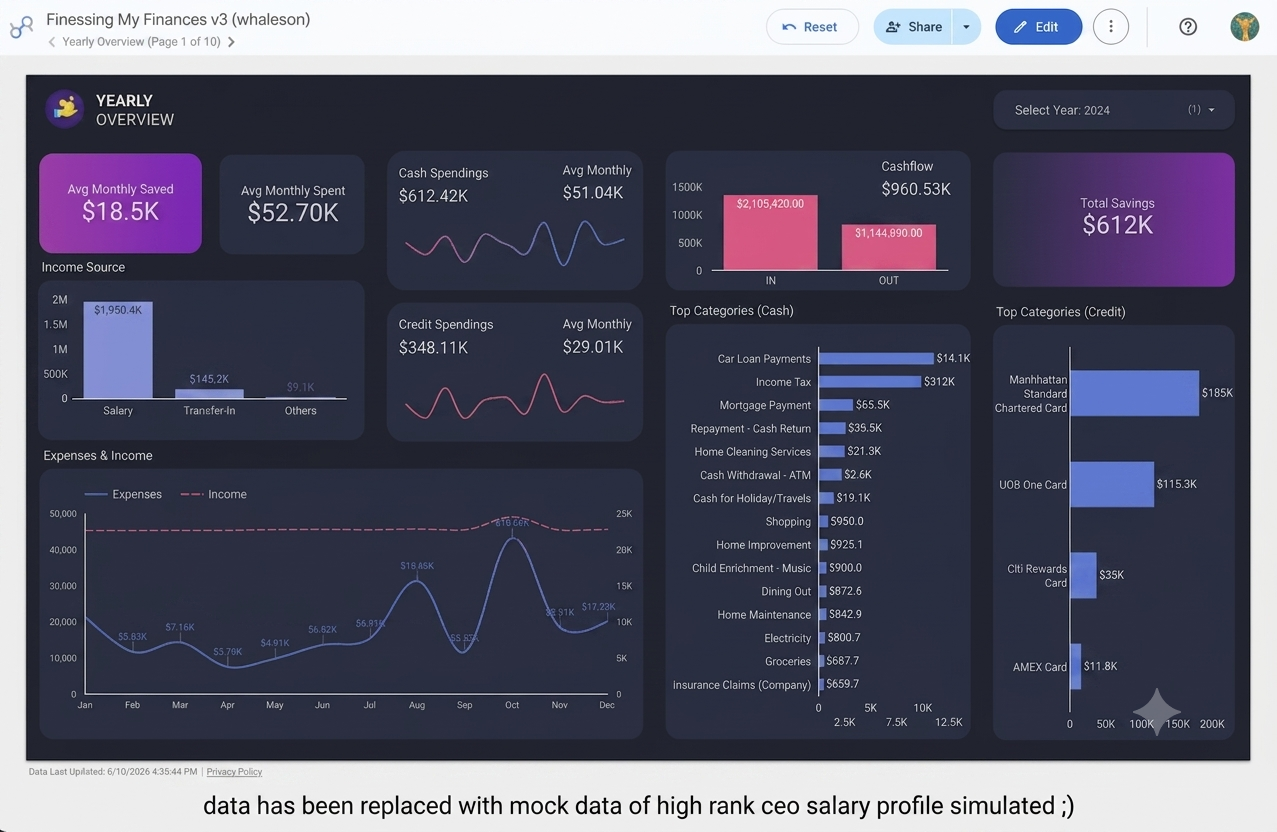
4. Visualizing Data with Looker Studio
Once data lands in BigQuery, I use Looker Studio to create dashboards showing spending trends, category breakdowns, and monthly comparisons.
The cost: under $2 a month
Here's the kicker: this entire pipeline costs less than $2 per month.
- Google Cloud Storage: Pennies for a few CSV files.
- Dataflow Run: Weekly job processes a few kilobytes. My job runs in minutes, costing less than $0.50 per run.
- BigQuery: Storage is cheap, queries are minimal. Monthly bill is under $1.
- Looker Studio: Free.
Total monthly cost: ~$1.50. That's less than a cup of coffee.
What went well
- Automation: The pipeline runs weekly, reducing manual effort.
- Learning: I gained hands-on experience with Dataflow, Apache Beam, and ML pipelines.
- Visualization: The Looker dashboard provides clear insights into spending habits.
Where I went overboard
- Complexity: For personal expense tracking, a simple Python script would suffice. I built a cloud-native ETL pipeline.
- Manual Steps: CSV uploads are still manual. An API-based solution would be more streamlined.
- Over-engineering: Using machine learning for categorization is overkill. Rule-based categorization would be simpler and faster.
But here's the thing: I wanted to learn Dataflow and Apache Beam. This project gave me a real-world excuse to build a pipeline, debug Beam code, and understand dataflow orchestration. The overkill was intentional.
Why I overkill everything
I'm the type of person who learns by doing. Reading documentation is fine, but building something, even if it's unnecessary, sticks. This project taught me:
- How to design a Beam pipeline with transforms, side inputs, and windowing.
- How to monitor Dataflow jobs and optimize for cost.
- How to integrate ML models into a streaming pipeline.
- How to visualize data with Looker Studio.
And I spent less than $2 to learn all that.
Want to build something similar?
If you're curious about Dataflow or Apache Beam, building a personal project is a great way to learn. You can start small and scale up as you learn.
The bottom line
I built a terabyte-scale data pipeline to track my coffee spending. It's overkill, unnecessary, and absolutely delightful. The cost is under $2 a month, and the learning is priceless.
Sometimes, the best way to learn is to overbuild. And if you're going to overbuild, you might as well make it cheap.